
B2B Meta Ads case study
Meta Ads Lead Generation Case Study for IT Services
Meta Ads for a B2B IT services business, with every campaign judged on the leads it brought in and what each one cost.
- Business
- B2B IT company (name withheld)
- Channel
- Meta Ads, lead generation
- Period
- 27 Jul 2023 to 27 Aug 2026
422K+
422,184 accounts reached.
872K+
872,407 impressions served.
15.7K+
15,751 link clicks recorded.
₹3.16L
₹3,15,738.23 across 118 campaigns.
Source: Meta Ads Manager | 27 Jul 2023 to 27 Aug 2026. Several visible lead-form campaigns recorded CPLs between ₹49.44 and ₹67.58. That range is taken from individual campaign rows and is not an account total. The account’s total row reports “multiple conversions”, so no single account-wide lead count or CPL is shown. The business isn’t named.
The business
An IT company selling to businesses
The business is an IT services company using digital acquisition to reach potential business customers and generate sales opportunities. Meta Ads was run as a lead-acquisition channel, so campaigns were expected to produce inquiries the sales team could follow up.
The starting point
Where we started
The objective was to use Meta Ads as a measurable lead-acquisition channel, with every campaign following the same path:
- Meta ad
- Landing page or lead form
- Lead
- Sales follow-up
The campaign data includes both Leads (Form) and Website Leads, so leads came in through more than one conversion path. Lead quality and sales outcomes aren’t part of the supplied data, so they aren’t reported here.
The challenge
What needed to change
Reaching likely buyers
In technology lead generation ads, a cheap click is wasted unless it comes from someone who could become a customer.
Judged on acquisition efficiency
Lead campaigns have to be measured on what each lead costs.
CPLs vary by campaign
Different campaigns can produce very different costs per lead.
Form and website paths behave differently
A lead form and a website conversion are separate paths with their own economics.
No single number tells the story
One account average hides too much, so performance has to be checked campaign by campaign.
Media costs under control
The aim is useful acquisition opportunities without letting spend drift.
Goals
What success looked like
- Generate leads
- Maintain an efficient cost per lead
- Build acquisition campaigns that can scale
- Identify the campaigns with stronger lead-generation efficiency
- Measure campaign performance consistently
Primary KPIs: leads, cost per lead, amount spent, reach, impressions, link clicks, and landing page and website lead activity. Reach and impressions were tracked for context; they don’t measure success on their own.
Approach
Our Meta Ads approach
B2B lead generation on Meta works when every campaign is tied to leads and budget follows cost per lead. In practice that meant:
- Lead-generation campaign structure
- Audience testing
- Creative testing
- Conversion-focused optimization
- Cost-per-lead monitoring
- Campaign-level analysis
- Budget allocation based on performance
- Ongoing optimization
What we did
Seven areas of work
What we changed in the account, and why each part affects cost per lead.
Campaign strategy
Campaigns were structured around lead-generation objectives and judged on measurable conversion activity. Reach and engagement came second.
Lead conversion paths
The account captured leads two ways: lead forms and website leads. Each path was tracked on its own, because the cost of a lead can differ a lot between them.
- Meta ad
- Lead form or landing page
- Lead
- Sales follow-up
Audience strategy
Each goal ran on three kinds of audience, set up as separate ad sets so they could be judged on their own: interest-based audiences for new reach, lookalikes of past leads and visitors to scale, and retargeting for people who already engaged. Spend moved toward the audiences producing leads at a workable cost.
- Interest-based audiences
- Lookalike audiences
- Retargeting audiences
Creative testing
B2B IT advertising has to make three things clear quickly: the business problem, why this company can solve it, and what to do next. Creative was judged on the leads it produced.
Performance optimization
Day-to-day decisions were based on the numbers tied to acquisition.
- Cost per lead
- Leads
- Spend
- Link clicks
- Campaign-level efficiency
Campaign-level analysis
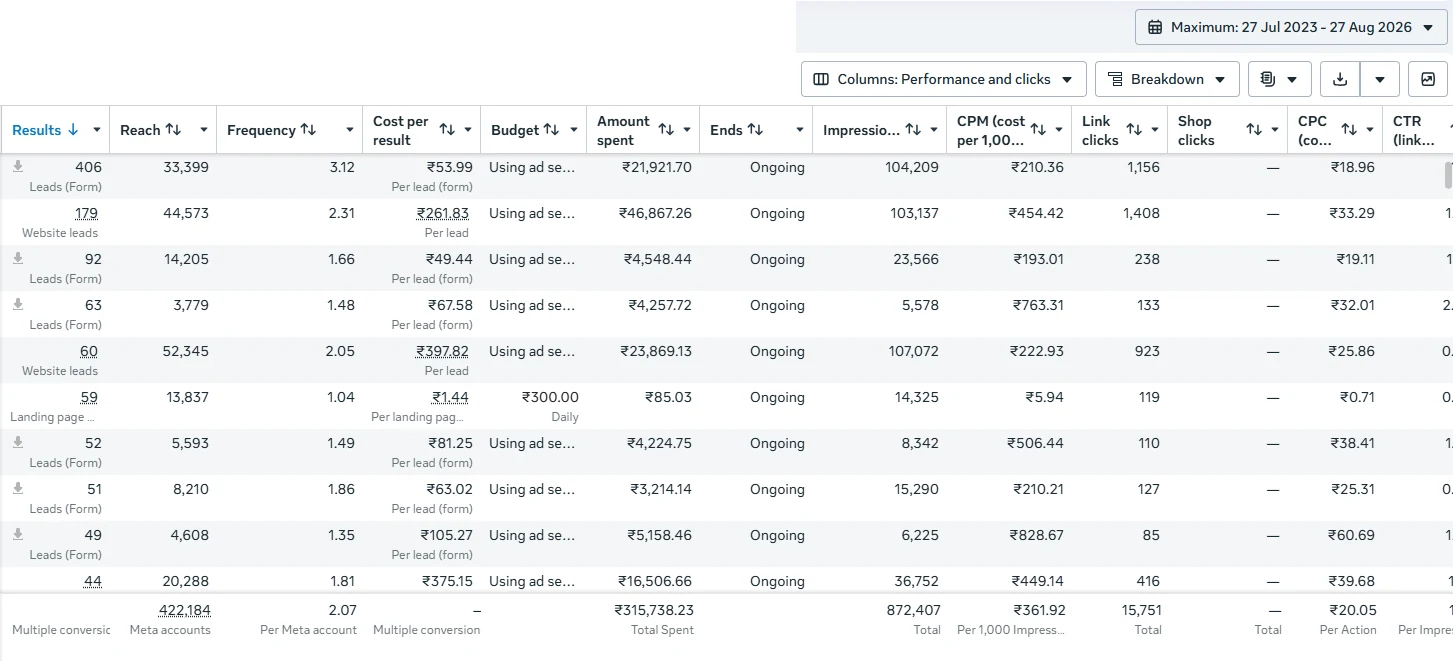
The account contains campaigns with very different CPLs. Visible examples in the screenshot include ₹49.44, ₹53.99, ₹63.02, ₹67.58, ₹81.25, ₹105.27, ₹261.83, ₹375.15 and ₹397.82 per lead. They show the spread between campaigns; the account has many more than these.
Optimization
Campaign-level data showed which acquisition paths were stronger and which were weaker, and that guided ongoing budget decisions.
Full-funnel structure
From cold audience to inquiry
Campaigns ran on two goals, landing page views and leads, and each was set up with separate audiences: interest-based audiences to reach new businesses, lookalikes to scale what worked, and retargeting to convert people who already knew the company. Leads came in two ways: instant lead forms on Meta, or inquiries through the landing page.
TOFU
Top of funnel: interest-based audiences
Reach business decision-makers who aren’t looking yet, using interests linked to the services offered.
- Landing page view campaigns (visible in the account at ₹1.44 per landing page view)
- Lead campaigns with instant forms: Leads (Form)
- Separate ad sets per interest group
Judged onLanding page views, cost per lead
MOFU
Middle of funnel: lookalike audiences
Scale by reaching people who resemble existing leads and engaged website visitors.
- Lookalikes built from past leads and landing page visitors
- Lead form campaigns: Leads (Form)
- Website lead campaigns through the landing page: Website Leads
Judged onLeads, cost per lead
BOFU
Bottom of funnel: retargeting
Turn people who already visited or engaged into inquiries the sales team can follow up.
- Retargeting landing page visitors who didn’t inquire
- Retargeting people who opened a lead form but didn’t submit
- Lead forms or landing page inquiries as the conversion goal
Judged onLeads, cost per lead
The screenshot shows both goals in action: a landing page view campaign alongside form and website lead campaigns. Account totals cover all 118 campaigns.
Campaign acquisition flow
From paid reach to lead acquisition
A conceptual flow using the account totals. It shows how the activity fits together; individual clicks won’t all have followed this exact sequence.
- 422K+ reach
- 872K+ impressions
- 15.7K+ link clicks
- Lead-generation campaigns
- Multiple lead conversion paths
Campaign performance
Selected visible lead-generation campaign examples
Cost per lead across six visible lead-form campaigns. Several recorded CPLs between ₹49.44 and ₹67.58, and the highest of these six was ₹105.27.
Conversion paths
Different conversion paths, different acquisition costs
The account included both form-based and website-based lead generation. In the supplied data, acquisition cost varied widely by conversion path and by campaign. The two visible website-lead campaigns:
₹261.83
179 website leads, ₹46,867.26 spent.
₹397.82
60 website leads, ₹23,869.13 spent.
Figures are cost per website lead. The higher cost doesn’t make the website path worse. No lead-quality data was supplied, and each path can suit a different stage or offer.
Lead economics
What a lead is worth: an estimate
Clients rarely share closed-deal or revenue data, and Meta doesn’t report it, so it isn’t in the data above. To put the cost per lead in context, the table below shows what a lead is worth under assumed close rates of 5% to 10%, for two typical project types. These are estimates based on typical close rates and project values, not reported results.
| Assumed project value | Value per lead at 5% close rate | Value per lead at 10% close rate |
|---|---|---|
| Website development, ₹25,000 | ₹1,250 | ₹2,500 |
| App development, ₹2,00,000 | ₹10,000 | ₹20,000 |
Value per lead is close rate × project value. Set against the visible CPLs, from ₹49.44 on the lowest-cost form campaign to ₹397.82 on the highest-cost website-lead campaign, even the most conservative case (₹1,250 per lead) sits well above the cost of acquiring a lead. That gap is why we manage CPL campaign by campaign.
Estimate only. Close rates and project values are typical figures used for context. The business did not report them. Actual returns depend on lead quality, sales follow-up and the mix of projects.
Meta Ads Manager
The evidence
Meta Ads campaign results from Ads Manager, with the account totals in the last row. Campaign names are removed.
Account totals
Reported figures in full
| Metric | 27 Jul 2023 to 27 Aug 2026 |
|---|---|
| Campaigns | 118 |
| Reach | 422,184 |
| Impressions | 872,407 |
| Link clicks | 15,751 |
| Amount spent | ₹3,15,738.23 |
| Results | Multiple conversions |
Source: Meta Ads Manager. Because the account tracks more than one conversion type, Meta doesn’t report a single total for results or cost per result, and neither do we.
Key lesson
Judge each campaign on its own numbers
More form submissions are only half the job. Each campaign needs checking on its own, because acquisition costs can vary a lot across campaigns and conversion paths.
In this account, visible lead-form campaigns ranged from ₹49.44 to ₹105.27 per lead, while visible website-lead campaigns were reported at higher costs. With a spread that wide, an account average tells you very little.
Takeaways
What this case shows
- Cost per lead can vary widely from one campaign to the next.
- Form-based and website-based acquisition should be measured separately.
- An account-level average can hide large differences between campaigns.
Services used
Paid advertising behind the results
- Meta Ads
- B2B lead generation through paid advertising
- Campaign structure
- Creative testing
- Cost-per-lead monitoring
- Budget allocation
Related
Related GrowthFueling services
See also our Meta Ads e-commerce case study or all case studies.
Looking to generate better leads with Meta Ads?
Tell us about your business, target market and acquisition goals. We’ll look at the campaign economics first and build the advertising strategy around them.