
E-commerce Google Ads case study
Food E-commerce Google Ads Case Study: 18.4K Purchases at 4.10x ROAS
Google Ads for a food and grocery e-commerce brand, measured on the purchases it drove and the return on every rupee spent.
- Business
- Food and grocery e-commerce business (name withheld)
- Channel
- Google Ads, purchases
- Period
- Q1 2020 to Q3 2026
4.10x
Reported as 410.49% Actual ROAS.
18.4K
Purchases recorded in Google Ads.
₹49.1L
₹4.91M total cost.
₹3.62
Average cost per click.
~₹2.02 Cr
Derived from reported 410.49% Actual ROAS × ₹49.1L spend. Not a directly reported metric.
Source: Google Ads | Q1 2020 to Q3 2026. Actual ROAS of 410.49% corresponds to approximately 4.10x return on ad spend. ROAS reflects attributed advertising performance and shouldn’t be read as net profit. The business isn’t named.
The business
A food brand selling direct online
The business sells food and grocery products online, with direct purchases going through its own website. Google Ads was run as a sales channel, so it was judged on purchases and return.
The starting point
Where we started
The objective was to use Google Ads as a measurable e-commerce acquisition channel, built around one path to purchase:
- Search and ad
- Product discovery
- Website
- Purchase
Across the reporting period the account shows 18.4K purchases / sales, 4.10x Actual ROAS and ₹49.1L in ad spend. Purchases stayed the focus throughout.
The challenge
What needed to change
Measured on purchases
E-commerce advertising has to be judged on purchases and commercial outcomes.
Intent varies by search
In online grocery advertising, product searches range from browsing to ready-to-buy.
Clicks don’t pay the bills
A lot of clicks says nothing about whether the advertising is paying back.
Watched against ROAS
Campaigns have to be watched against purchases and return. Volume on its own proves little.
Ongoing work
A long-running account drifts unless someone keeps adjusting it as demand and costs change.
Scaling with return in view
Raising spend only makes sense while return holds up.
Goals
What success looked like
Primary goal: drive measurable e-commerce purchases while maintaining a strong return on advertising spend.
- Purchases / sales
- Actual ROAS
- Advertising spend
- Average CPC
- Conversion efficiency
- Campaign-level performance
Clicks and impressions were tracked but weren’t the measure of success. Profit, margin and order values aren’t shown because they weren’t part of the supplied data.
Approach
Our Google Ads approach
We run e-commerce Google Ads for the long term and measure the return. Every step, from search term to product page, is judged by whether it leads to a purchase at an acceptable return.
- Understand product-level search demand
- Build campaigns around purchase intent
- Match search terms with relevant products
- Optimize ad and landing-page relevance
- Track purchases accurately
- Monitor ROAS and acquisition economics
- Review campaign-level performance
- Scale where efficiency supports it
- Keep optimizing over time
What we did
Seven areas of work
What was done, and why each part affects e-commerce sales on Google.
Purchase intent
Food e-commerce PPC goes after people actively looking for products to buy. Raw traffic volume was never the target.
Product relevance
Search demand was connected with the most relevant product destinations, so a shopper lands on the product they searched for.
Ad relevance
Each ad was written to match the product and the search behind it. Better-matched ads bring better clicks and more purchases.
Conversion tracking
Decisions depend on measuring actual purchases. The account reports 18.4K purchases / sales, and that is the primary outcome this case is judged on.
ROAS monitoring
Campaign decisions weighed return against cost, using several numbers together:
- Spend
- Purchase value
- ROAS
- CPC
- Purchase volume
Performance optimization
Campaigns were monitored and adjusted continuously as performance, demand and competition changed.
Long-term management
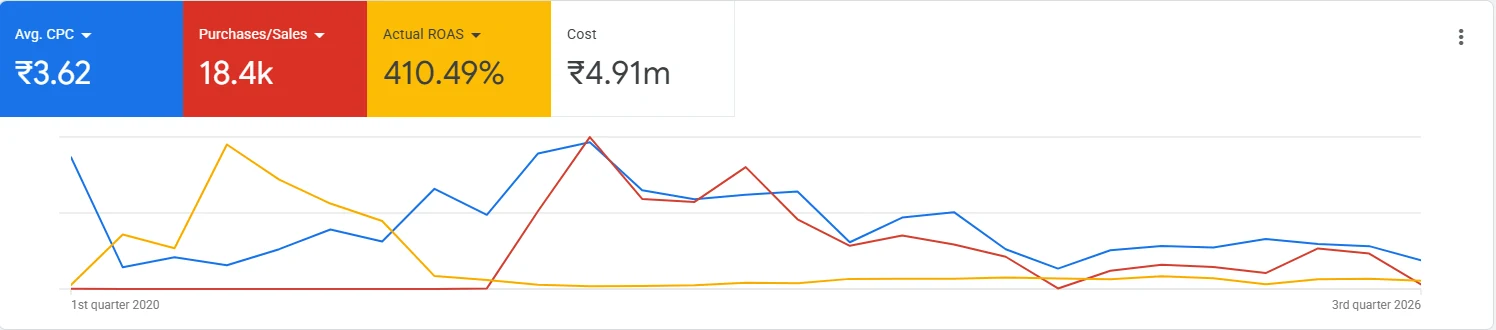
The supplied reporting runs from Q1 2020 through Q3 2026, so it covers years of the account’s e-commerce advertising. Performance wasn’t identical across that time, and the chart below shows how it moved.
Full-funnel structure
From product discovery to purchase
Demand Gen introduced the products to new shoppers at the top of the funnel. Search, Shopping, Performance Max, brand campaigns and remarketing covered the rest of the path, from comparing products to completing the purchase.
TOFU
Top of funnel: Demand Gen
Get the products discovered by shoppers who don’t know the brand yet.
- Demand Gen campaigns for new shoppers
- Product-led creative that sends people to the store
Judged onNew visitors, engaged visits, CPC
MOFU
Middle of funnel: comparison
Show up while shoppers search the category and compare products.
- Search campaigns on category and product terms
- Shopping and Performance Max for product discovery
- Remarketing to category and product page visitors
Judged onClicks, CPC, purchases
BOFU
Bottom of funnel: purchase
Close the sale with shoppers already close to buying.
- Brand search campaigns
- Shopping campaigns on best-selling products
- Dynamic remarketing to product viewers and cart abandoners
Judged onPurchases, ROAS
Account totals above include all stages. The 4.10x Actual ROAS is a blended figure across Demand Gen, Search, Shopping, Performance Max and remarketing.
Long-term performance
Purchases at scale, with a measured return
Across the period the account recorded 18.4K purchases at a reported Actual ROAS of 410.49%.
₹49.1L
Total cost.
18.4K
Recorded in Google Ads.
4.10x
Reported as 410.49%.
Performance over time
A multi-year view of the account
The supplied reporting tracks purchases, ROAS and CPC over several years. The chart is the original Google Ads trend view. Quarterly figures aren’t shown because they weren’t supplied.
E-commerce performance flow
From search demand to measured ROAS
- Search demand
- Google Ads
- Product discovery
- Website
- Purchase
- Measured ROAS
Every campaign was tied to recorded purchases. This diagram shows how the activity fits together; individual clicks won’t all have followed this exact sequence.
Reported figures
Account totals in full
| Metric | Q1 2020 to Q3 2026 |
|---|---|
| Purchases / sales | 18.4K |
| Actual ROAS | 410.49% (≈ 4.10x) |
| Cost | ₹4.91M (₹49.1L) |
| Average CPC | ₹3.62 |
| Approx. attributed sales value (derived) | ~₹2.02 Cr |
Source: Google Ads. The attributed sales value is calculated from reported ROAS and spend (₹49.1L × 4.1049) and was not reported directly. It reflects Google Ads attribution only and is not total business revenue or profit.
Key lesson
Clicks are only part of the picture
For e-commerce advertising, the useful measure is whether paid traffic produces purchases at an acceptable return. This account was judged on purchases and ROAS over several years. Short-term traffic numbers carried little weight.
The supplied reporting shows 18.4K purchases / sales and a reported 410.49% Actual ROAS across Q1 2020 to Q3 2026.
Takeaways
What this case shows
- Measure e-commerce Google Ads against purchases and the return on spend.
- E-commerce Google Ads ROAS gives a more useful view of performance than traffic volume by itself.
- A long-running account needs continuous monitoring and adjustment after launch.
Services used
Paid advertising behind the results
- Google Ads
- E-commerce Ads
- Purchase tracking
- ROAS monitoring
- Ad and landing-page relevance
- Ongoing optimization
Related
Related GrowthFueling services
See also our Meta Ads e-commerce case study or all case studies.
Want better e-commerce performance from Google Ads?
Tell us what you’re selling, where you’re advertising and what you’re trying to achieve. We’ll look at the acquisition economics first.